
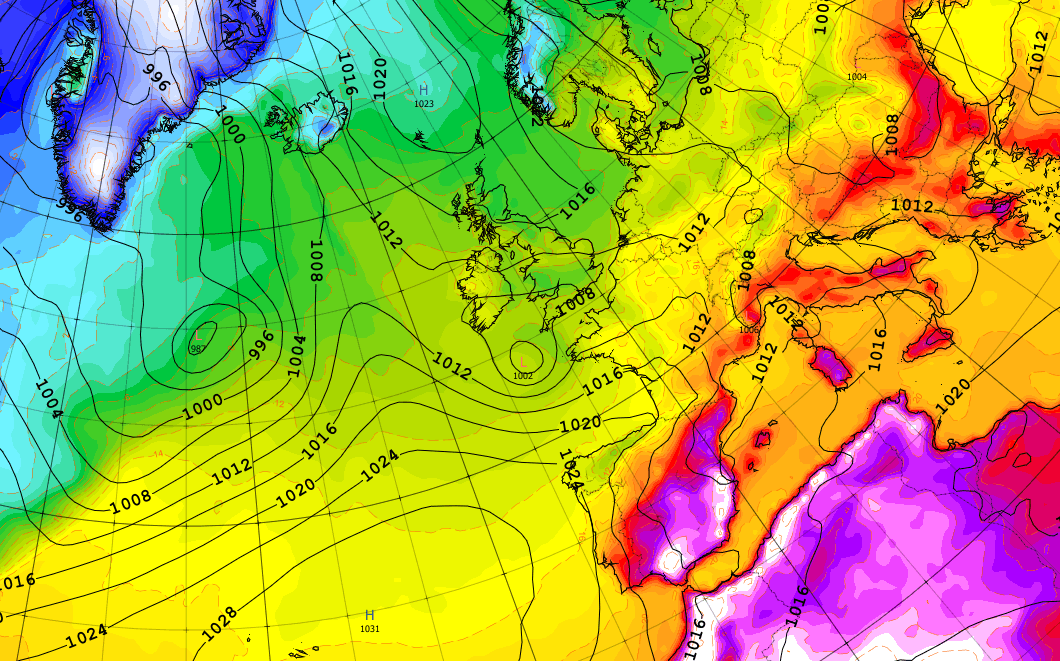
The calibration layer between raw forecasts and a decision.
Weather centres publish skilful forecasts well beyond two weeks. The work that makes them usable is calibration: learning, from decades of past forecasts, how each one should be corrected for a given place, season, and lead time.
We calibrate the forecast. We deliver the probability you need.
- Bias corrected
- Uncertainty corrected
- Per location, season, and lead time
Illustrative values. Delivered by API and dashboards, in production today.
Four steps, run every day.
Global ensemble forecasts at medium, extended, and seasonal range, refreshed as each centre issues them. Alongside, the reforecast archives: the same models run over the past 20 years, so each forecast can be compared with what followed.
Calibration models learn, per location, season, and lead time, where the raw output sits relative to outcomes and how wide its uncertainty should be. Training uses proper scoring rules, so the objective is the quality of the whole distribution rather than a single central value.
Calibrated daily distributions are aggregated into the client's own terms: monthly degree days at a settlement station, a policy trigger over a coverage window, growing-degree-day accumulation, or a freeze probability inside a crop stage.
Outputs go out by API, dashboard, file, or report. Every issued forecast is archived as issued, then scored when the outcome is known. Skill is reported against climatology and, where relevant, against market prices.
Three forecast regimes, one consistent view.
Different systems carry skill at different ranges. We calibrate each on its own record and join them into a single term structure, so the seven-day view and the seven-month view are consistent with each other.
Daily ensemble runs, calibrated per location. The range where skill is highest and where spot and near-dated markets react.
Extended-range ensembles, where regime signals such as tropical and stratospheric variability carry the information. Overlaps the medium range deliberately.
Seasonal ensembles conditioned on slowly varying drivers such as ocean state. Skill is reported honestly by month and location; where it is absent, climatology is returned.
Scored, archived, and reported as found.
The continuous ranked probability score is the primary metric. It rewards calibration and sharpness together and penalises overconfidence.
Backtests use forward and rolling splits over 20 years. Results are reported per station, per month, and per lead.
Skill is stated relative to operational climatology, the baseline most users otherwise rely on. Where there is no improvement, we say so.
Every forecast is stored as issued. Any number shown later can be traced to what was available at the time.
In production today, in the form your team already uses.
Every channel draws on the same point-in-time archive, so a number seen on a dashboard can be reproduced from the API or from the files for the same issue date.
Point-in-time forecasts and verification data as JSON. Suits systematic desks and model pipelines.
Role-based views for traders, operations planners, and risk managers. Hosted by us, branded for you.
Scheduled CSV or Parquet drops into your storage, with the scenario paths behind every index.
Per-contract or per-portfolio risk reports in your units, prepared by our team.
Query probabilistic forecasts for a location and date, with thresholds you set, and pull historical observations by ZIP code. Preview access runs without a key.
Built for the New Jersey AI Challenge with Plug and Play: a resident view, a utility operations view of peak-risk windows, and a trading-desk view of weather hedge pricing.
Start with a benchmark on your own locations.
We score our calibrated forecasts against climatology on the stations, contracts, or fields that matter to you, and share the full record. The benchmark runs before any commercial commitment.
Or write to info@ilikallc.com