
Every field, every week, from orbit.
Satellite data for index construction, index validation, and field monitoring, from single fields to whole regions. Agriculture leads the applications.
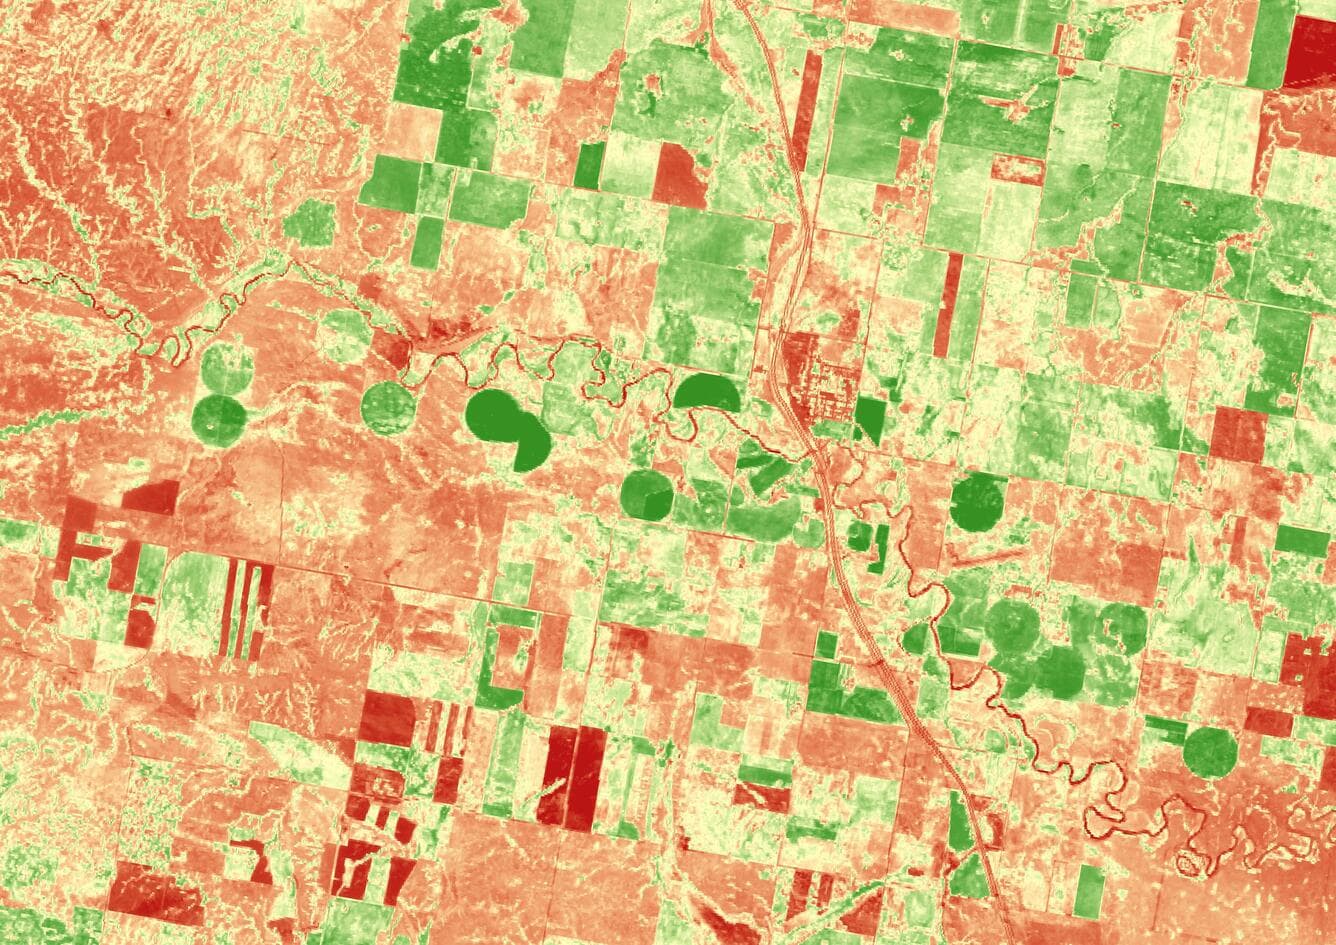
One data layer. Three jobs.
The satellite layer serves the same discipline as the rest of the engine: indices you can construct, validate, and watch.
Index construction
Satellite-derived indices such as vegetation vigour and moisture stress, built as trigger inputs for parametric structures.
Index validation
An independent check on station and gridded records: did the index reflect what the field experienced? Basis risk, quantified.
Field monitoring
Crop condition every few days, per field, published as trends and imagery agronomists can read without GIS tools.
What the ground is doing, from orbit, every few days.
Each satellite pass is processed automatically for every field you manage, and published as trends, imagery, and comparisons your agronomists can read without GIS tools.
Per-field canopy vigour and biomass from Sentinel-2 at 10 m, cloud-masked and comparable over time.
Canopy and soil moisture between irrigations, surfacing dry-down before it is visible in the field.
A red-edge signal that reads canopy condition where standard vigour indices saturate.
Daily temperature, humidity, wind, and rainfall per field, with stress days and growing-degree-day accumulation.
Treatment-versus-control field pairing, to quantify an input or practice against a matched baseline.
Live spreadsheets and dashboards with trends, imagery, and summaries, refreshed on every satellite pass.
Sentinel-2 indices used: NDVI, NDMI, NDRE. Weather from ECMWF ERA5-Land. Permanent and row crops, estates, and natural-capital reporting.
Growers, processors, input companies, and their insurers.
Plan labour, inputs, and protective measures against frost and heat, with lead time.
Season-ahead supply outlooks by sourcing region, for procurement and logistics.
Replant, germination, and establishment risk by location and planting date.
Satellite-backed indices and monitoring for crop-weather covers and portfolios.
Satellite indices can construct a trigger, and check one.
A parametric cover can settle on a satellite-derived index, and an existing index can be validated against what the satellite saw on the ground. Both run through the same calibration and verification discipline.
We started with farmers.
Ilika began with Hawamaan, a free weather app for farmers in drought-prone regions of India, built on NASA satellite data. NASA featured the story in its Spinoff publication. The field work since then, from orchards to row crops, is the same idea with better tools: put a usable number in front of the person making the decision.
Start with one field, or one orchard block.
A trial covers the locations you name: satellite monitoring, plus calibrated frost and season outlooks, for one season. You see the results before any commitment.
Or write to info@ilikallc.com